Stacked Bar Chart
The Stacked Bar view allows you to visualize the results of your query in two dimensions: the first is grouped in bars along the x-axis; the second dimension is grouped vertically within each bar.
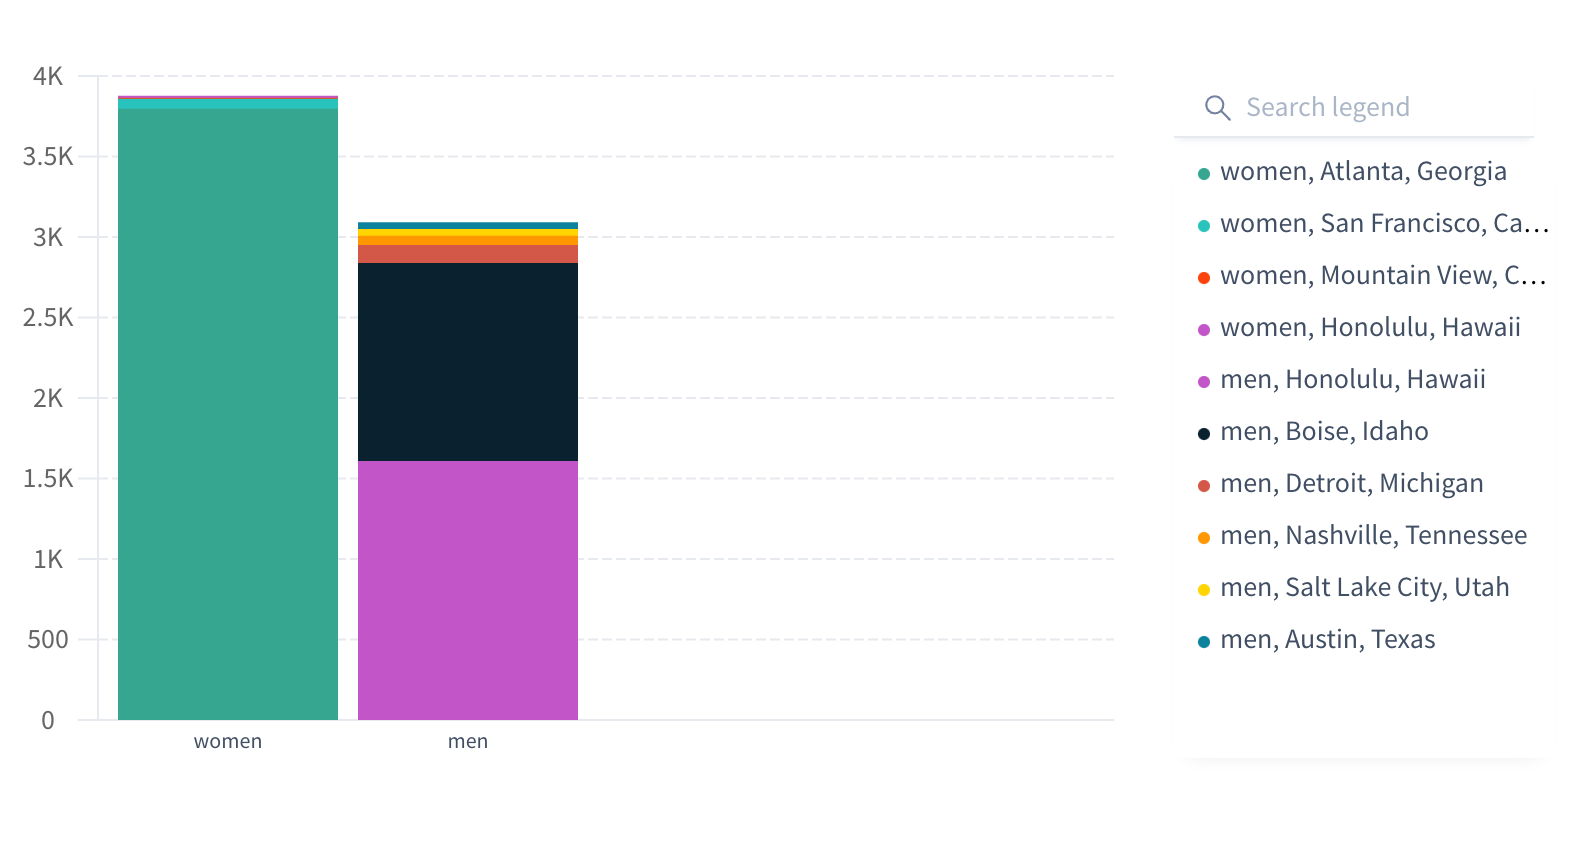
In this example, results are grouped first by gender, and then for each gender, in stacks by location.