Analyze a Distribution [v5]
Analyze the distribution of numeric properties that describe people, their behaviors, and how they traverse through your experience using Scuba's distribution view.
Why use distributions? Sometimes it’s not enough to know what the average user is like in your experience. For example, if you have different user segments who exhibit different behaviors, you might find that there are different modes according to your usage metrics. Or you might want to look for power users who act like extreme outliers. Distributions can help illuminate these cases.
Use distribution view
To get started:
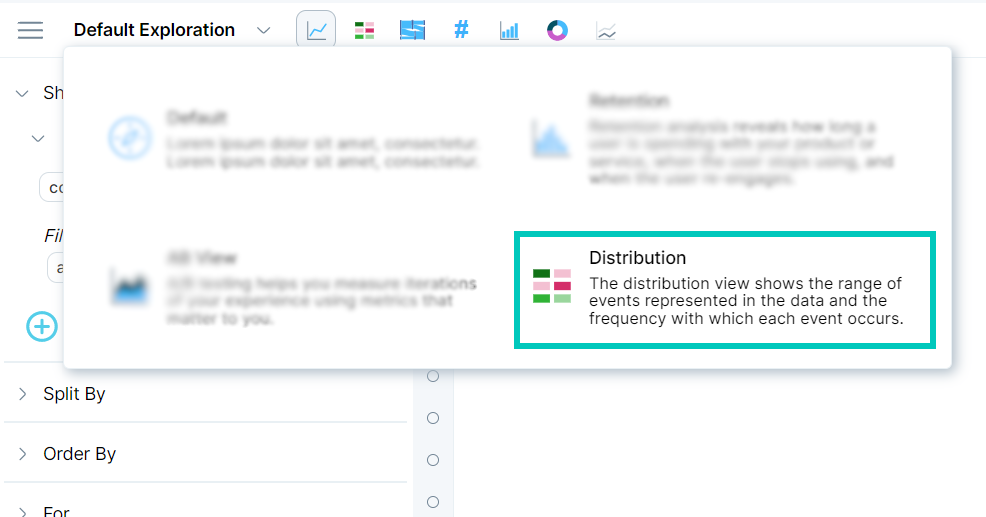
In Explore, click the Default Exploration drop-down menu, then click Distribution.
You will be prompted to pick an actor property, event property, or a flow property. Only numeric properties are available.
In the Starting and Ending fields, select a time range you want to examine that property over.
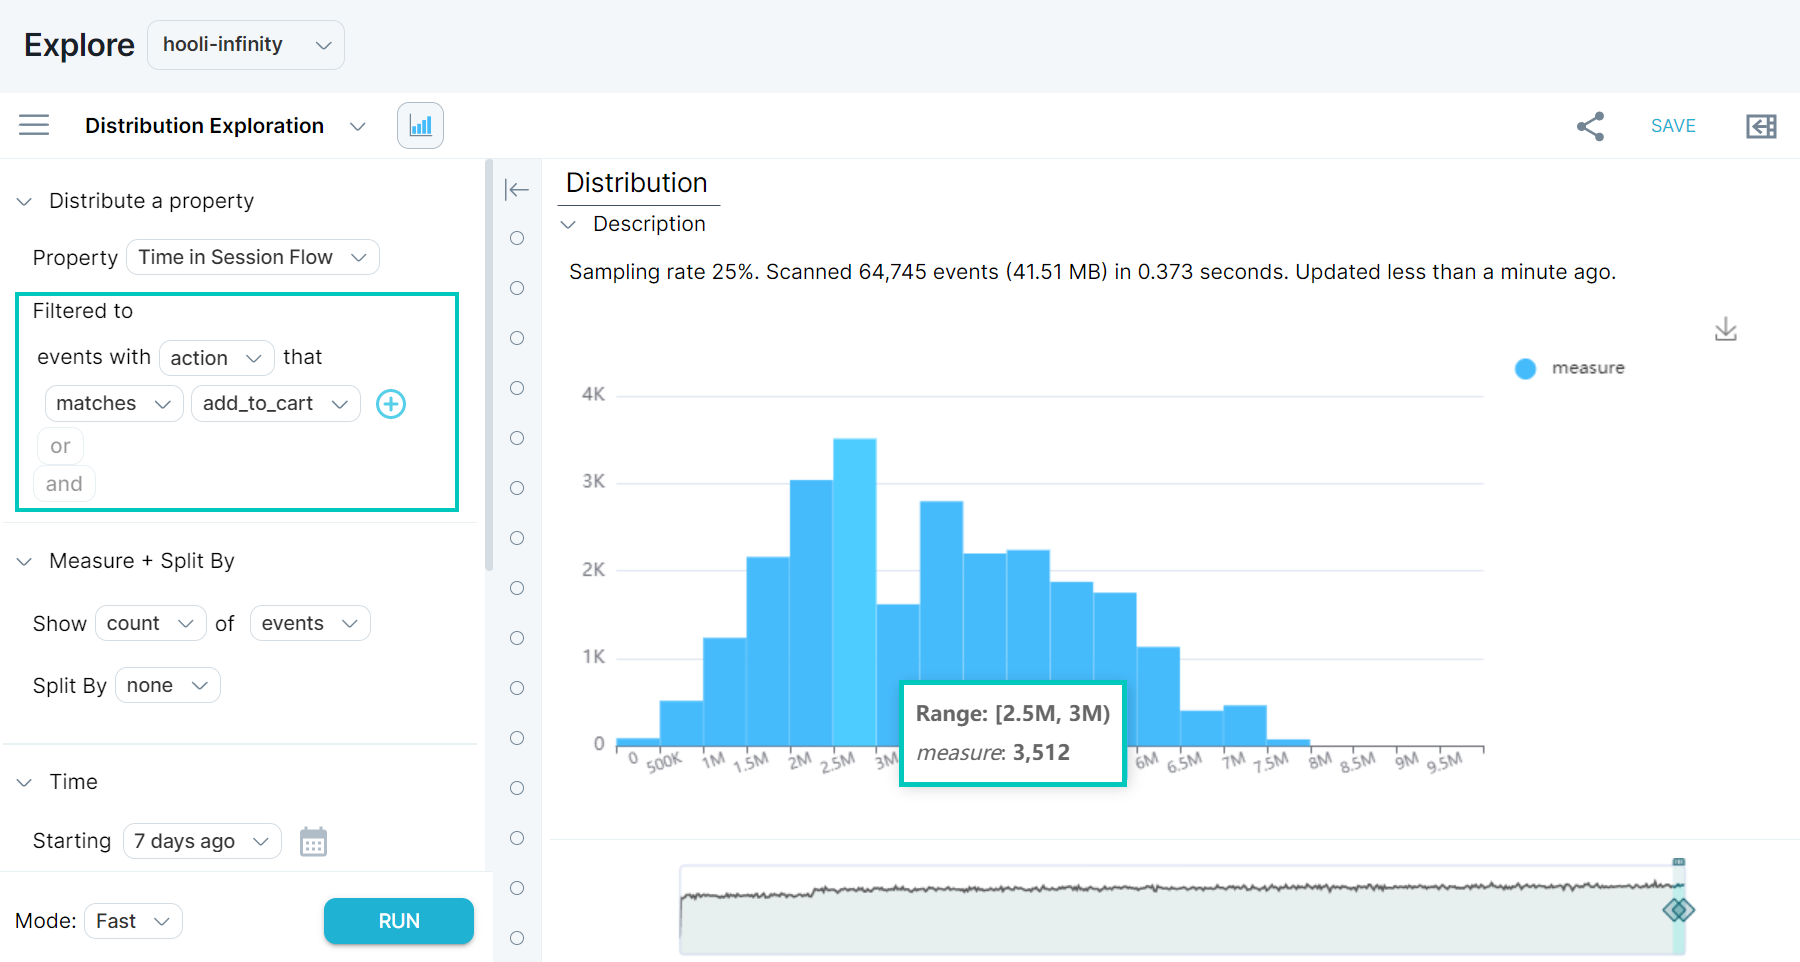
Hit Run. Scuba suggests a default binning and displays a histogram.
Adding a filter in distribution view
To look at one part of the distribution, you can apply a filter to your property, similar to how you would in a measure.
Note that ranges (and percentiles) identify inclusive and exclusive elements. A bracket indicates an inclusive range, and a parenthesis indicates an exclusive range. For example, integers described with this notation are as follows:
(0, 3) = 1, 2.
[0, 3) = 0, 1, 2.
[0, 3] = 0, 1, 2, 3.
Adjusting binning
In v5, Scuba offers you the choice of automatically optimizing the bins, so that they are evenly distributed. If you don’t want to do that, then you can adjust the number of bins or the size of the bins. Use the sliders to select an amount.
Note: When you change one slider, the other will automatically shift to match. If you want them to be specific values, you’ll have to change both sliders.
Adjusting binning also lets you create interesting analyses. When investigating event properties, you can bin by either a count of all events, over a property, or over a calculation of a property.
Example: Find total spending per age bracket
For example, consider a commerce dataset with an event property called Age.
If you are interested in the distribution of all types of events, you can select the Age event property and filter to all events.
But you can also find the distribution of total money spent per age bracket, as follows:
Under Distribute a property, click the first line and select the Age event property from the dropdown.
Filter to events with action that matches purchase_confirmed.
In the line that says Filtered to all events, click all events and type action to find the action event property.
Select action from the list. The UI updates to say Filtered to events with action that matches ...
Click the ellipses and select the value of interest from the dropdown. In this example, the value is purchase_confirmed.
Click Modify Bins
Adjust the Number of Bins to 10 and Size of Bins to 5 to see fewer bins with more data in each.
The default measure specified is Measure count of events. Modify to Measure sum of price as follows:
Click count to access the list of available functions.
Select sum.
Click events to access the list of available properties.
Start typing and select price.
Click RUN.
The result is a distribution of total money spent per age group.
