Analyze a distribution
Analyze the distribution of numeric properties that describe people, their behaviors, and how they traverse through your experience using Scuba's distribution view.
Why use distributions? Sometimes it’s not enough to know what the average user is like in your experience. For example, if you have different user segments who exhibit different behaviors, you might find that there are different modes according to your usage metrics. Or you might want to look for power users who act like extreme outliers. Distributions can help illuminate these cases.
Use distribution view
To get started:
In the left menu bar, click Apps, then in the center panel click Distribution.
In the Event property field, pick an actor property, event property, or flow property. Only numeric properties are available.
In the Starting and Ending fields, select a time range you want to examine that property over.
Hit GO. Scuba suggests a default binning and displays a histogram.
For example, say your data set has an actor property BodyHeight. In this example, you might select a BodyHeight actor property. When you press GO, you’ll see a histogram of your user height.
Adjust the range
To look at one part of the distribution, you can apply a filter to your property. You can do this in either of two ways:
You can explicitly define limits, using the "Filtered to" line in the query builder. For example, if BodyHeight is in units of inches and you want to look at people greater than 6 feet tall, apply “Filtered to BodyHeight is greater than 72” to the original binning property.
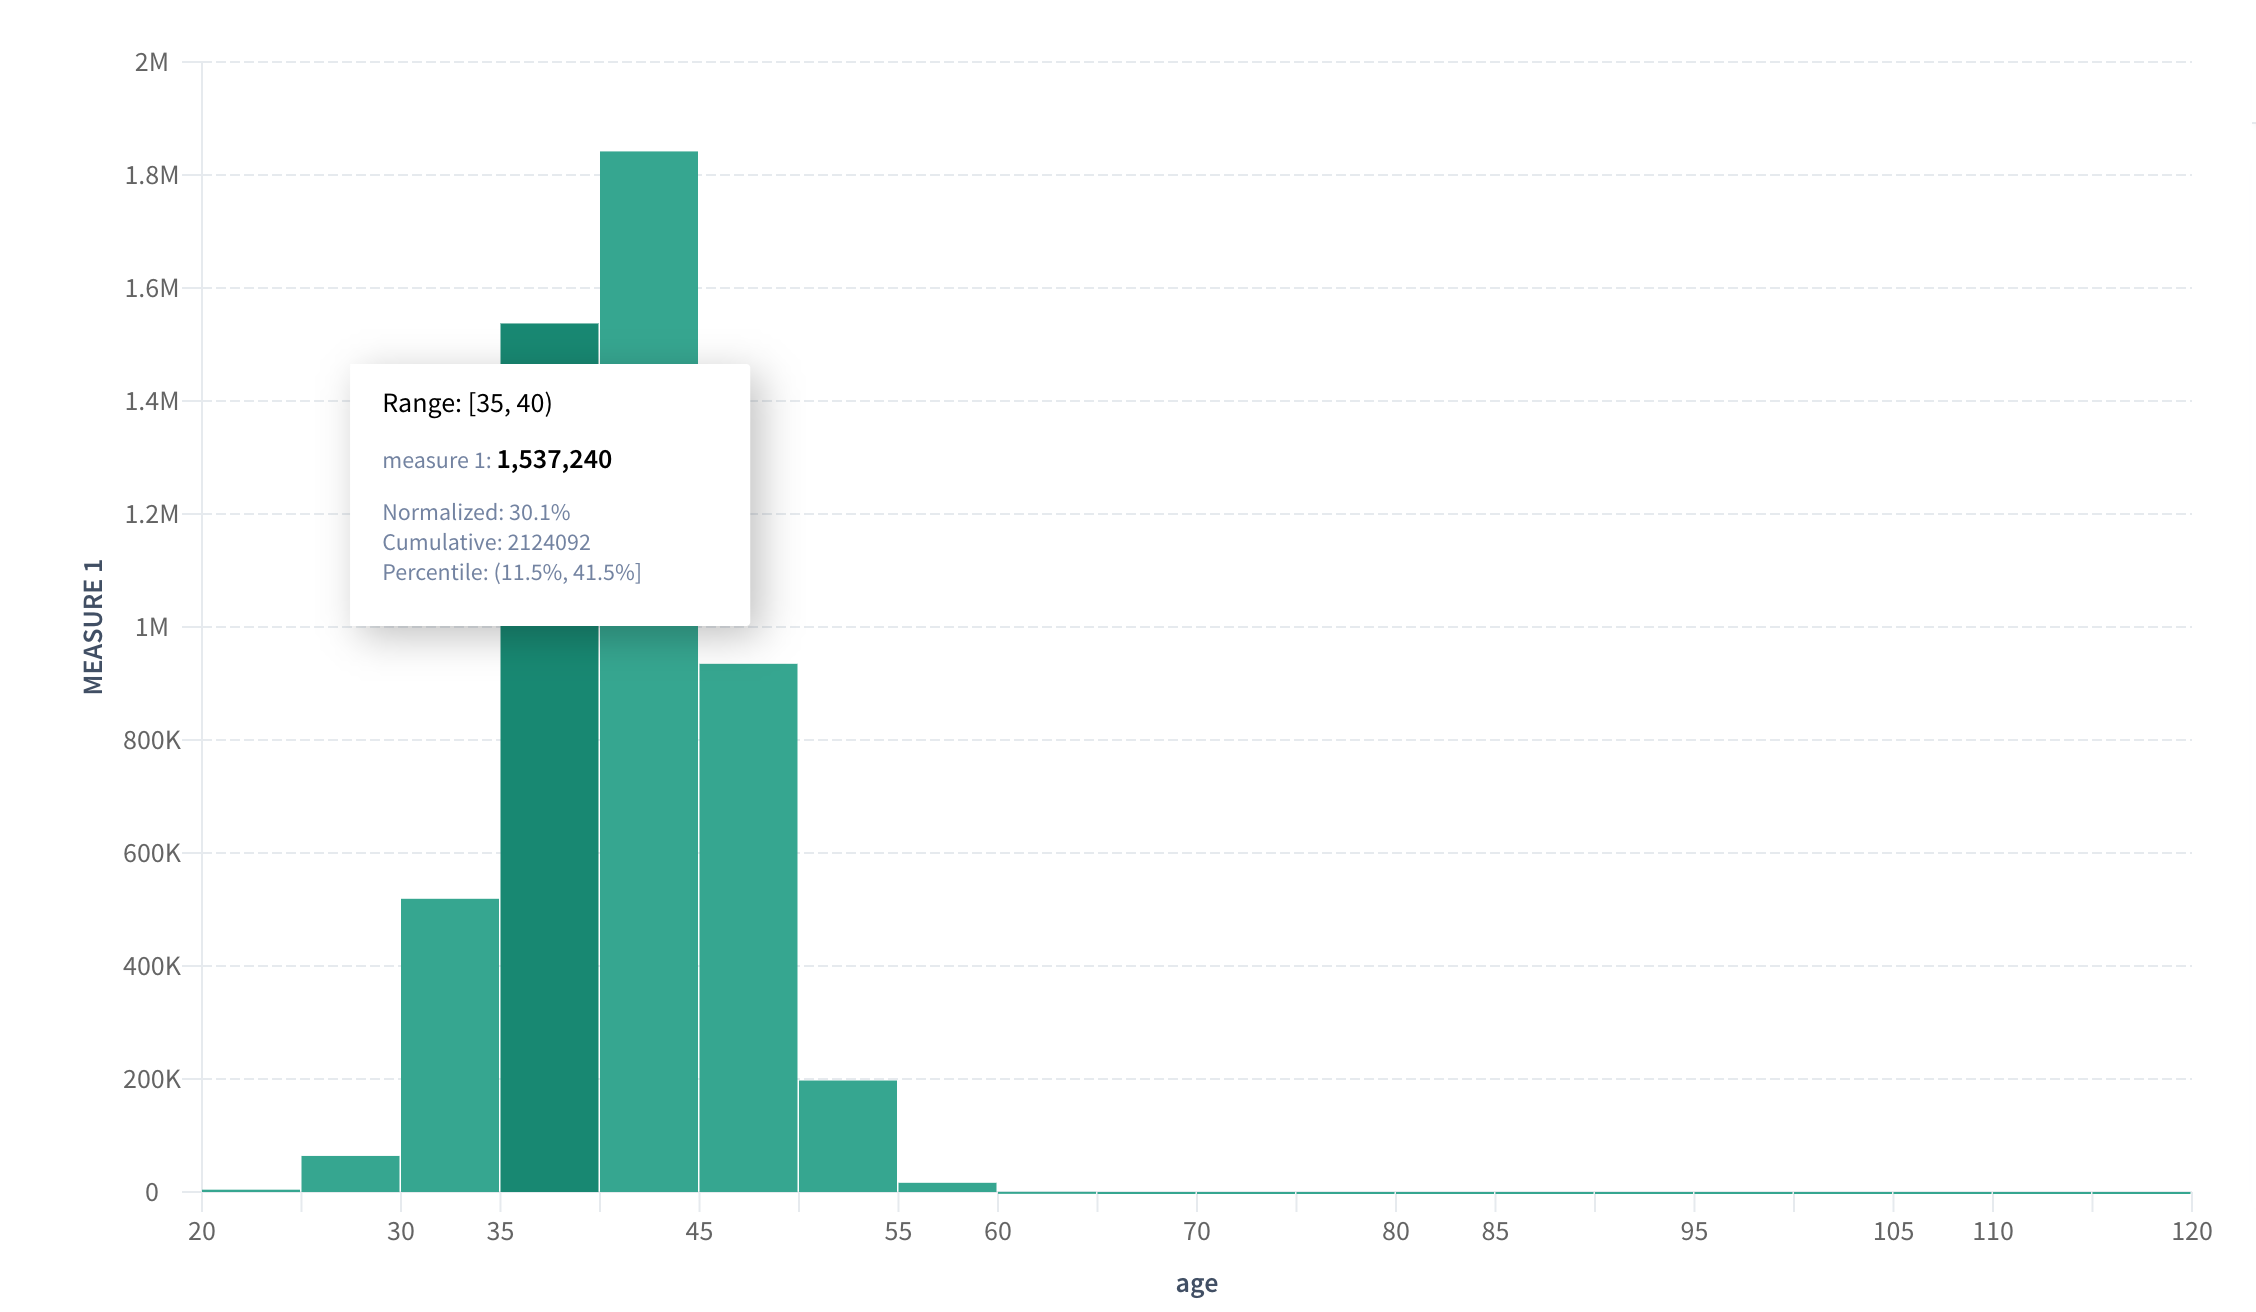
Or, to zoom in on any particular bin, click the bin and then click Zoom in. Scuba applies the relevant filters in your query.
Whichever way you filter the range, zoom out by clicking the trash icons next to the value filter.
Note that ranges (and percentiles) identify inclusive and exclusive elements. A bracket indicates an inclusive range, and a parenthesis indicates an exclusive range. For example, integers described with this notation are as follows:
(0, 3) = 1, 2.
[0, 3) = 0, 1, 2.
[0, 3] = 0, 1, 2, 3.
Adjust display units
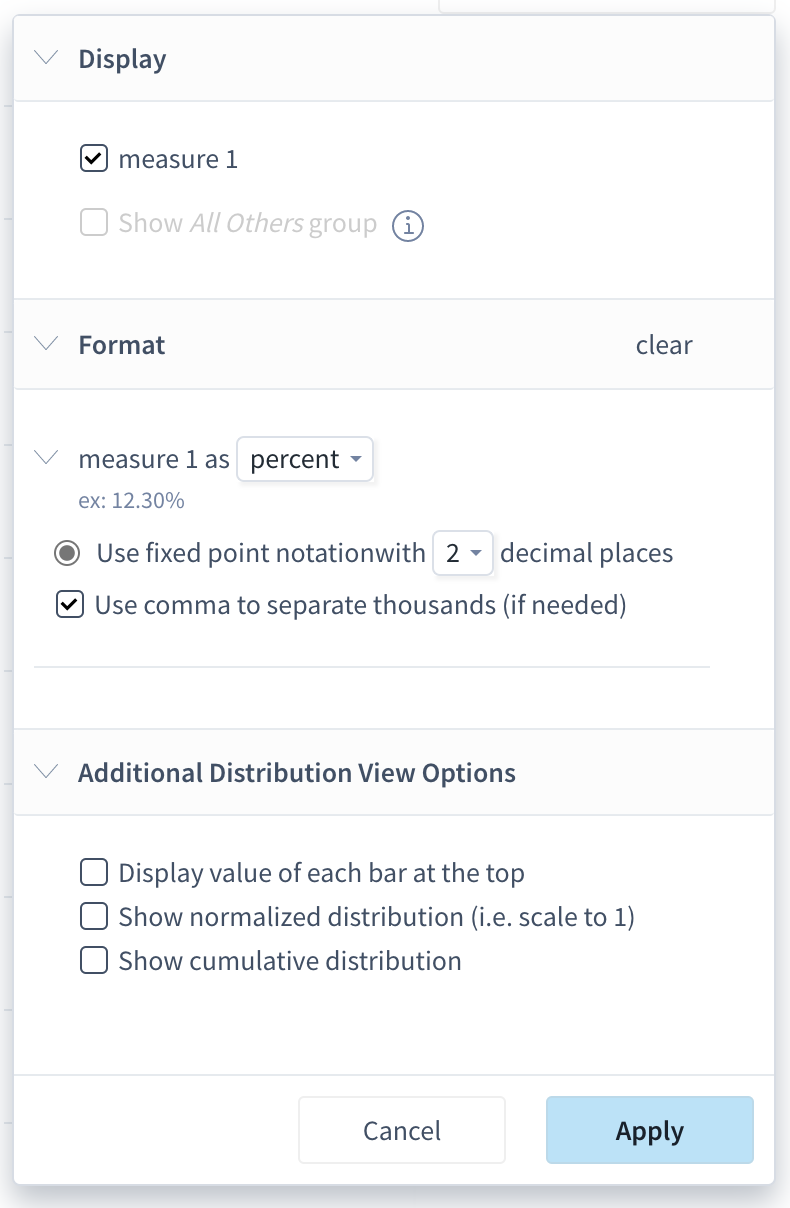
At the top right of the screen, click Chart options to adjust the units that the chart displays in. The top sections of the chart options dialog is standardized across Explore and apps, and the section on the bottom is specific to distribution view. Combinations of chart options unlock a variety of display options.
To display the y-axis in percentiles:
At the top right of the screen, click Chart options.
Under Format, change auto to percent.
Under Additional Distribution View Options:
Select Show normalized distribution.
Select Show cumulative distribution.
Click Apply.
Regardless of the chart options selected, the tool tip always displays the percentile (along with normalized percent and cumulative).
Adjust binning
To adjust the binning while you are zooming or adjusting the range, click Modify Bin+Measure.
You can adjust the bin size or count. When you pick one, Scuba automatically recalculates the other based on the range of values in your bin property and applied filters.
Adjusting binning also lets you create interesting analyses. When investigating event properties, you can bin by either a count of all events, over a property, or over a calculation of a property.
Example: Analyze song lengths
As a basic example, consider a music service dataset with an event property called SongLength.
If you are interested in the distribution of songs played over the past couple weeks, irrespective of the unique songs, then distribute across SongLength, using the default query.
However, if you are more interested in seeing the distribution of unique songs, then click Modify Bin+Measure. The default measure specified is count of events. To count the unique songs played, in the Measure field, select Song. As a result, you will get a distribution of SongLength for unique songs.
Bin by a calculated property
You can go beyond counting unique things: you can sum or average different properties over your binning property. Do this by creating bins based on a count or other function (sum, percentile, and so on) of a specific attribute.
Let’s return to our original example binning property: SongLength. To learn how SongLength relates to total play for all song plays, adjust your measure to sum of SongLength. Your resulting distribution might not look like a Gaussian curve anymore, but you might be able to discover whether your users spend more time playing shorter or longer songs.
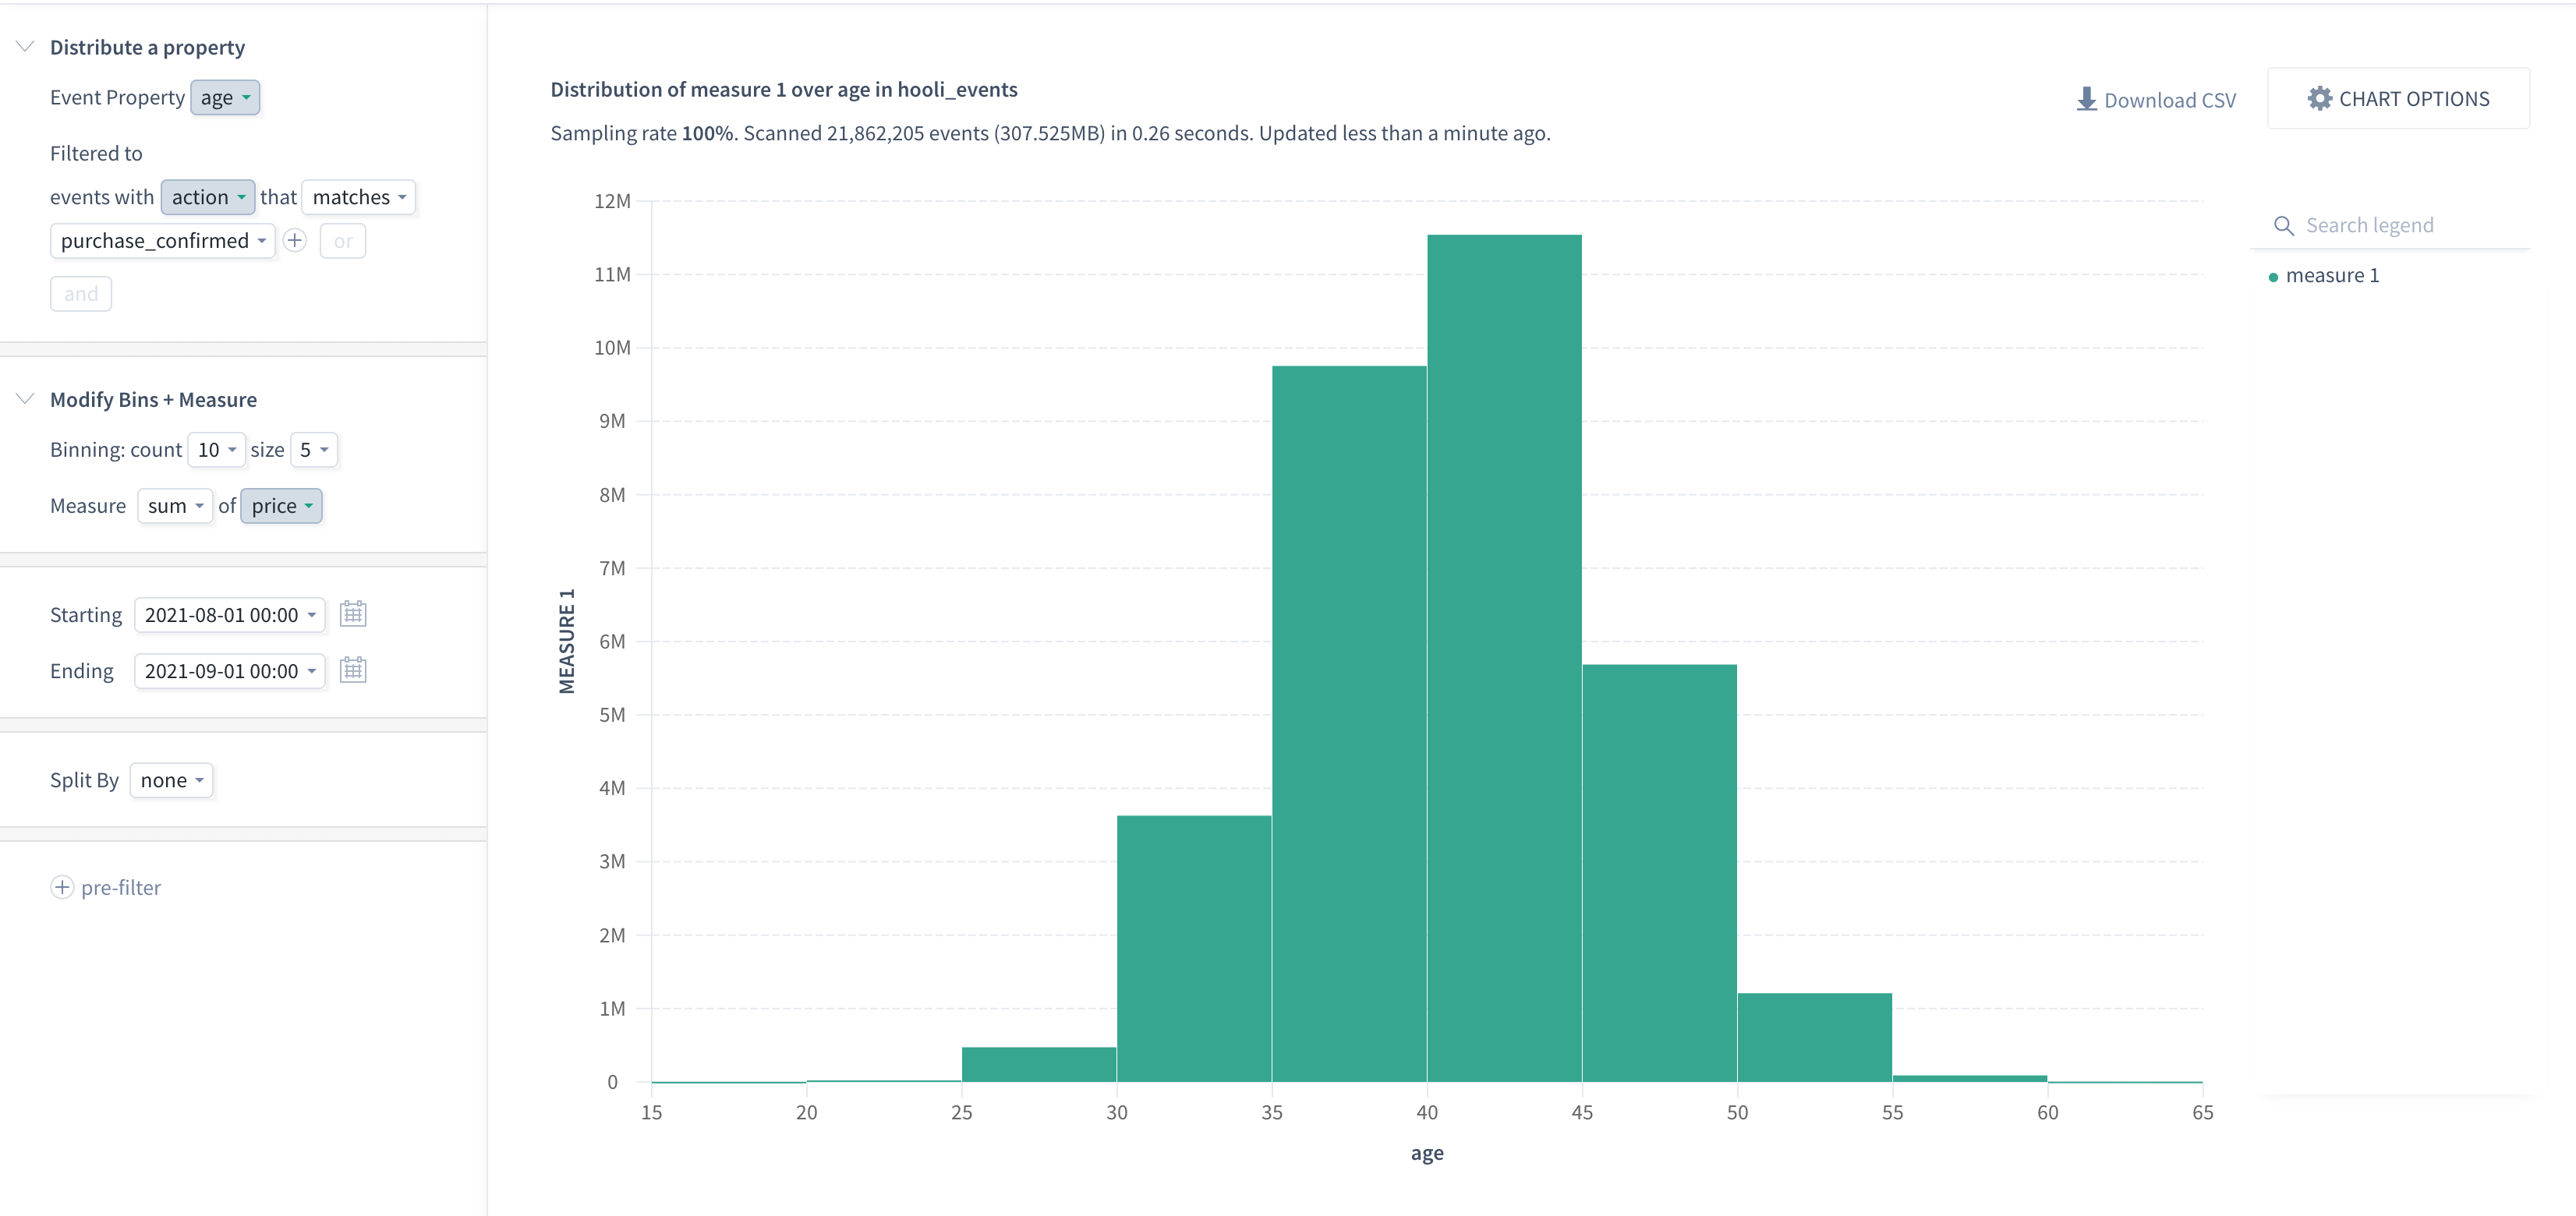
Example: Find total spending per age bracket
For example, consider a commerce dataset with an event property called Age.
If you are interested in the distribution of all types of events, you can select the Age event property and filter to all events.
But you can also find the distribution of total money spent per age bracket, as follows:
Under Distribute a property, click the first line and select the Age event property from the dropdown.
Filter to events with action that matches purchase_confirmed.
In the line that says Filtered to all events, click all events and type action to find the action event property.
Select action from the list. The UI updates to say Filtered to events with action that matches ...
Click the ellipses and select the value of interest from the dropdown. In this example, the value is purchase_confirmed.
Click Modify Bin+Measure.
Adjust the Binning: count to 10 and size to 5 to see fewer bins with more data in each.
The default measure specified is Measure count of events. Modify to Measure sum of price as follows:
Click count to access the list of available functions.
Select sum.
Click events to access the list of available properties.
Start typing and select price.
Click Go.
The result is a distribution of total money spent per age group in August 2021.