Jump Start
The Scuba UI is designed for daily interactive, exploratory use by a variety of users, including users in “non-technical” roles such as product, marketing, content development, support, and sales, as well as engineers and data scientists.
Scuba encourages rapid iteration with point-and-click query building and interactive visualizations. Boards let you go from any panel to explore the underlying data, changing parameters and drilling down to inspect and understand what’s behind the summary. Users who previously were passive viewers of data can become active investigators.
Use the Scuba UI to run ad hoc queries and visualizations in Explore, springboard into analyses with apps, work with your data with properties, and pin useful queries and analyses to boards.
Boards
Boards provide a space to collect and organize queries in visual panels. You can add custom panels, then modify parameters to drill down and further explore the data.
Board icons
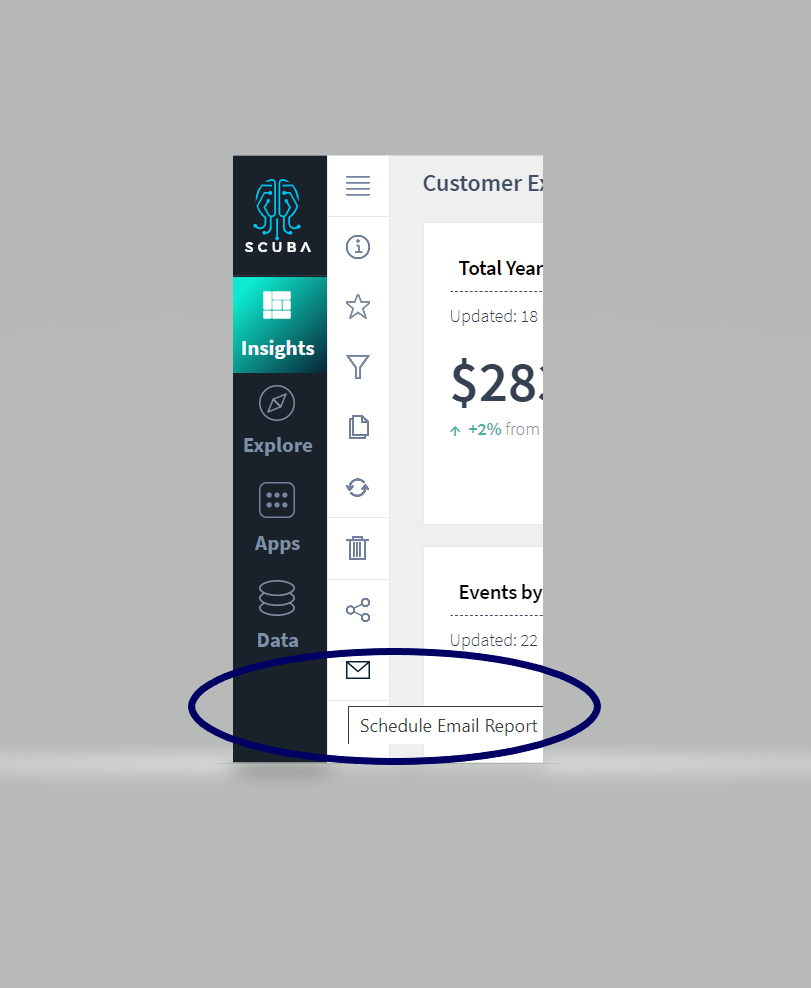
When you click the Boards icon in the left navigation bar and select a board, a list of icons appears on the right. Boards icons facilitate the tasks you perform with boards:
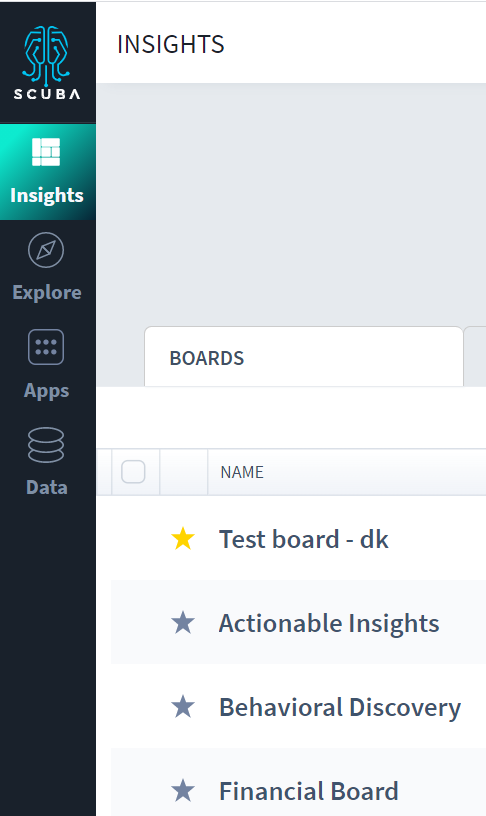
Select a Board—Displays a list of boards. You can select a board from the list or create a new board.
Board Info—Displays a description and detailed information about the current board.
Favorite Board—Adds the current board to your list of personal Favorite boards.
Filter Board—Allows you to construct and simultaneously apply filters to all panels on the current board.
Duplicate Board—Makes a duplicate copy of the current board, appending "copy" to the board name.
Refresh Board—Updates the data on all the panels of the current board.
Delete Board—Prompts you for confirmation before deleting the current board.
Share Board—Copies the URL for the current board, so you can send it to another individual or an entire team.
Email Board—Emails the board to a list of users.
Favoriting boards
There are two types of Favorite boards: personal favorites and global (or admin) favorites.
Personal favorites appear at the top of your list of boards, and are highlighted with a yellow star. Clicking the Favorite icon adds the current board to your personal list of favorite boards.
Global favorites appear after any personal favorites in the list, and are marked with a gray star. An Scuba admin sets the global favorites.
Read more about managing your objects in Change the visibility of properties.
Renaming a board
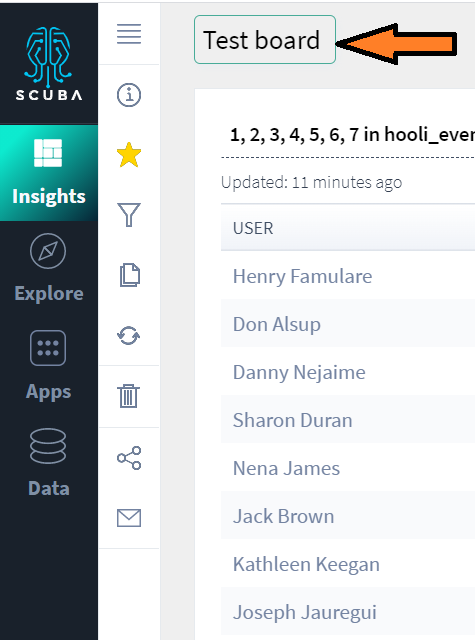
You can rename any board you've created or have write access to by clicking inside the text field and entering the new name.
Moving panels
You can move a panel on the board by clicking the icon in the bottom right corner and dragging it to the new location. The other panels on the board rearrange themselves accordingly.
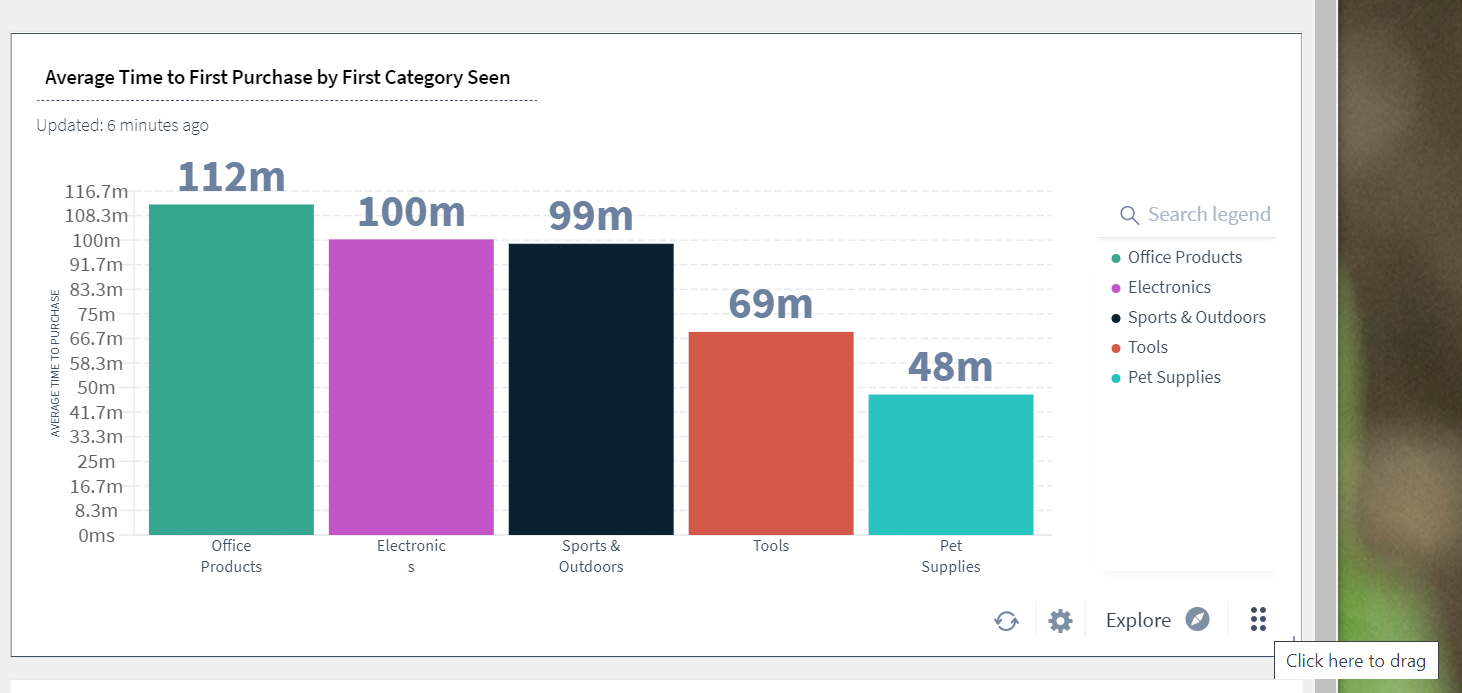
Viewing panel details
You can view the details of a panel by hovering the cursor over an area. A tooltip dialog appears with the details of that data point.
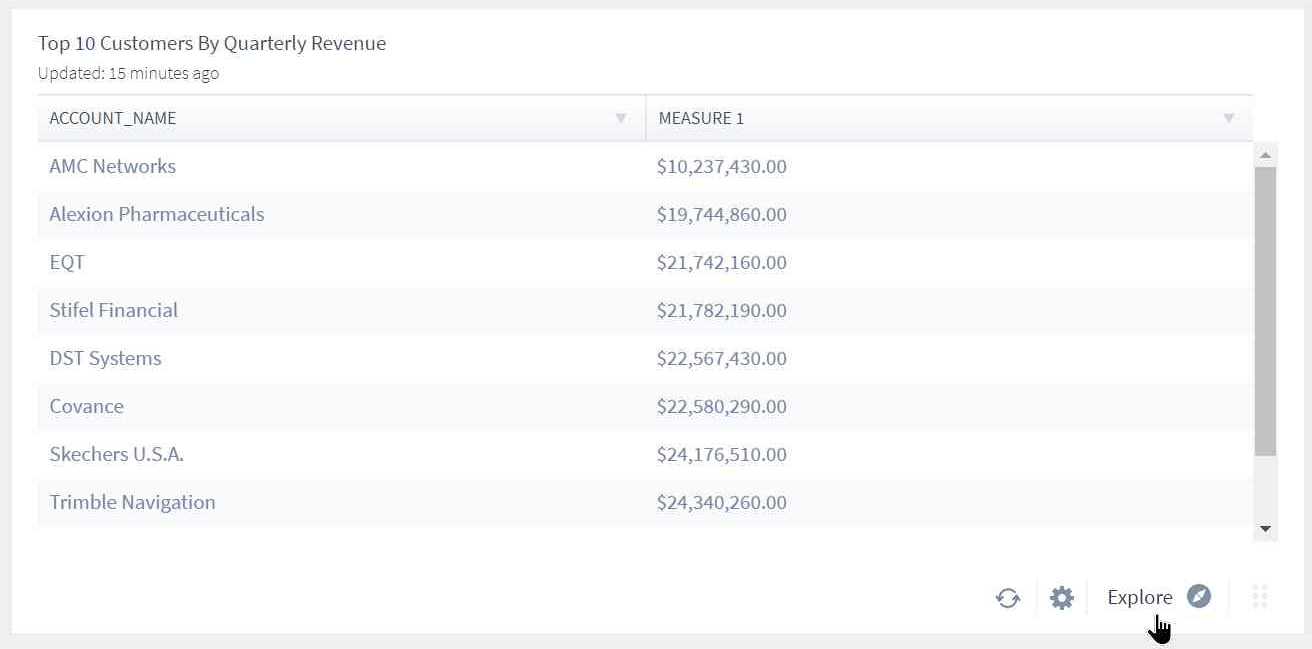
Opening a panel in Explore or app view
You can open a panel in Explore by clicking Explore in the bottom right corner of the panel.
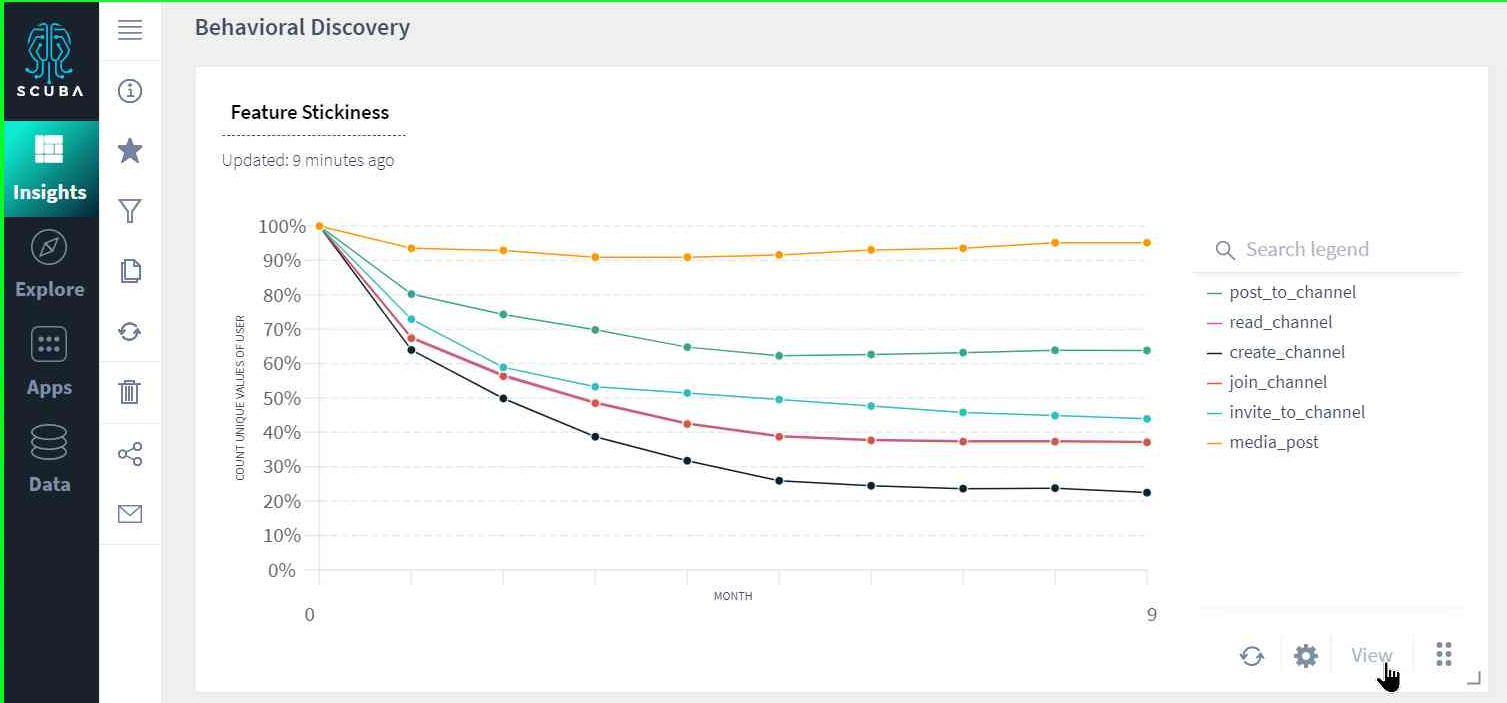
Scuba includes several apps for streamlining certain types of analysis, like retention, distributions, or A/B testing. If a panel has been created using one of these apps, you can open the panel in the app by clicking View in the bottom right of the panel.
See Create a board and add a panel in the tutorial.
Customize boards with saved board filters
You might want to display the same data from one board but filtered to different geographic regions, or filtered by some other segment.
You can accomplish this by creating a board with all of the information you're interested in, duplicating the board, creating a board filter on the copied board for the first region of interest, saving the board, and repeating for other regions of interest.
See Customize a board for multiple audiences with saved board filters in the User's Guide.
Explore
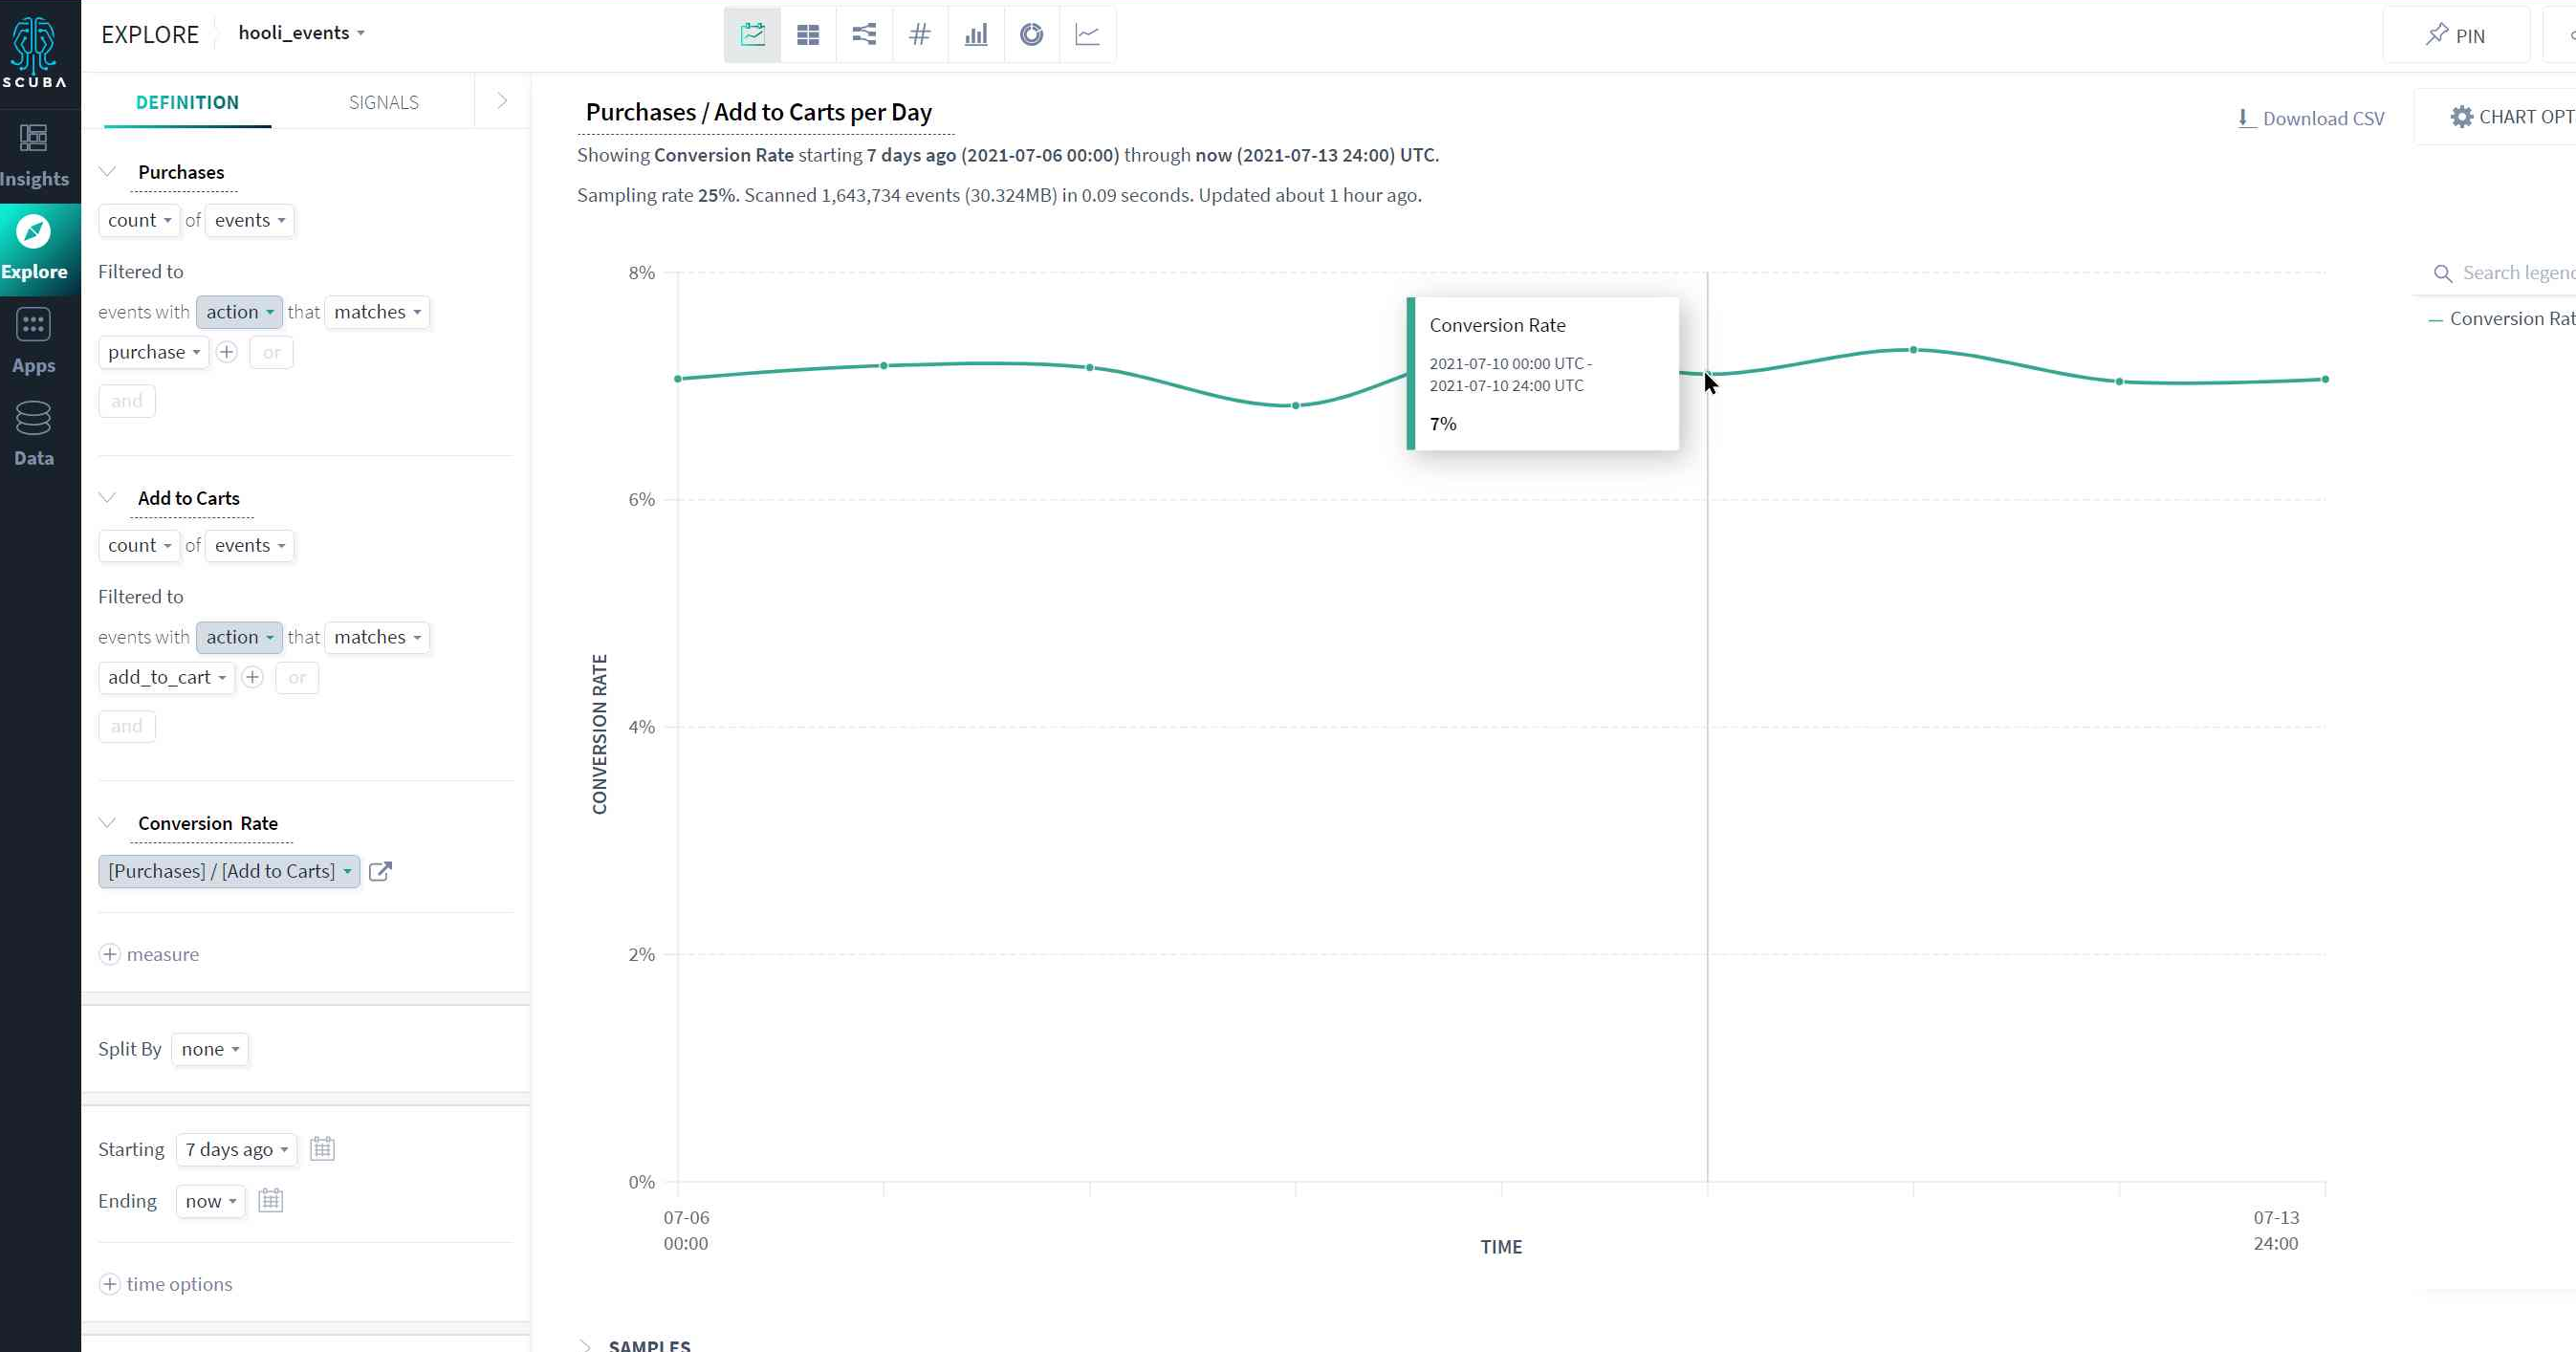
Explore is where you construct queries and analyze results in various formats. You can also modify existing queries to explore the data on a granular level.
Constructing a query
The sentence model query builder lets you create queries that read like an actual sentence.
The sentence model query builder is on the left side of the Explore view window, as shown in the following example. When you make a selection in the query builder, valid options—from the data and action dictionary—are shown from which you can choose. For more information, see the step-by-step instructions for creating a simple query in Create a board and add a panel.
Viewing queries in different formats
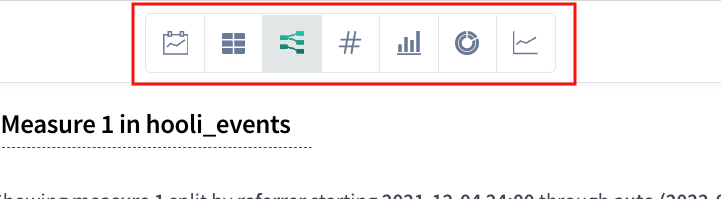
Switch between query result visualizations by clicking the icons at the center-top of the Explore window: Time View, Table View, Sankey view, number view, bar view, pie or sunburst view, and line view.
Query results are displayed in Time View by default. Not all query results apply to all formats.
The following example shows a flow in Sankey view.

Pinning a query (to a board)
You can pin a query to a board as a panel for monitoring and quick reference. Simply click the Pin icon at the top of the Explore window and select a board. For more information, see Create a board and add a panel in the tutorial.

Apps
Apps let you streamline analysis and reach insights quickly. Access apps in the left menu bar.
Flows
Use flows to take a sequence of events by a particular actor, then segment a chunk of those events to operate on with finer granularity.
Retention
Retention analysis reveals how long a user is spending with your product or service, when the user stops using, and when the user re-engages. This helps you learn which features are sticky, which features turn away users, and the level of customer loyalty.
See Analyze user retention or engagement with the retention module in the Users Guide.
A/B view
A/B testing helps you measure iterations of your experience using metrics that matter to you.
See Analyze A/B testing results in the User's Guide.
Distribution
Distribution view shows the range of events represented in the data and the frequency with which each event occurs.
See Analyze a distribution in the Users Guide.
Data model
The data model shows your event data along with user-defined objects: actor properties, event properties, flows, flow properties, and measures.
Event properties
The Event properties tab displays a table of event properties you can use to construct queries. You can also create a new Event property by clicking the button in the top right corner of the window. For more information, see Create an event property.
Click an event property in the table to view details for the property, as shown in the following example.
Actor properties
The Actor properties tab displays a table of actor properties you can use to construct queries. You can also create new Actor properties by clicking the button in the upper right corner of the window. For more information, see Create an actor property.
Click an actor property in the table to view details of the property. You can modify the property by changing the option selections in the panel on the left.
Flows
Use flows to take a sequence of events by a particular actor, then segment a chunk of those events to operate on with finer granularity.
For more information, see Create a flow.
Click a flow in the table to view the flow. You can modify the flow by changing the option selections in the panel on the left and then re-running the query. For information, see Modify a query.
Measures
You can create a flow using a Show or Calculate method and use the new measure in a top-level query. For more information, see Determine a ratio in the Tutorial.
Help
Clicking the Help icon takes you to the Scuba versions 3 and 4 documentation page. You can view help topics in a selection of 3.x/4.x Guides.
Navigate to Scuba 2.x and general topics by clicking the links in the top right corner of the window.
What's Next
Now that you've gotten your bearings with the Scuba layout and functionality, you can jump in and create a board and add a panel.